
Epidemiology focused products and services
Epidemiology forecast models and insights built for the pharmaceutical industry and allied organizations.
G26 Epidemiology Forecast
Epidemiology forecast models for non-oncology indications
In-depth, rigorously researched epidemiology forecast models covering 26 high-income countries* (including China). Available as interactive downloadable Excel dashboards with accompanying PDF study report.
“*Australia, Austria, Belgium, Canada, China, Denmark, Finland, France, Germany, Greece, Ireland, Israel, Italy, Japan, Netherlands, New Zealand, Norway, Poland, Portugal, Singapore, South Korea, Spain, Sweden, Switzerland, UK, USA.
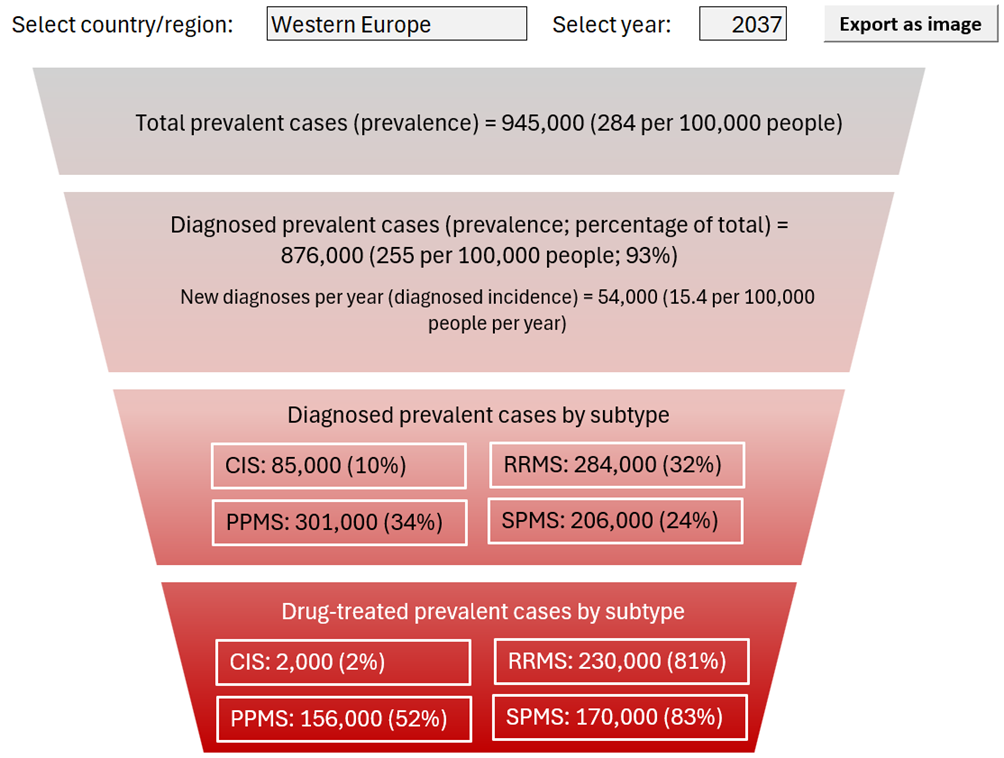
All our G26 Epidemiology Forecast Models have one or more interactive patient funnel or patient flow diagrams which can be exported as image files and displayed for any combination of country and forecast year. In our partner program, epidemiologist hours can be used to add/remove patient populations and derive patient funnels from a different perspective.
G26 Oncology Forecast
Epidemiology forecast models for oncology indications
In-depth, rigorously researched cancer epidemiology forecast models covering 26 high-income countries* (including China). Available as interactive downloadable Excel dashboards with accompanying PDF study report.
* Australia, Austria, Belgium, Canada, China, Denmark, Finland, France, Germany, Greece, Ireland, Israel, Italy, Japan, Netherlands, New Zealand, Norway, Poland, Portugal, Singapore, South Korea, Spain, Sweden, Switzerland, UK, USA.
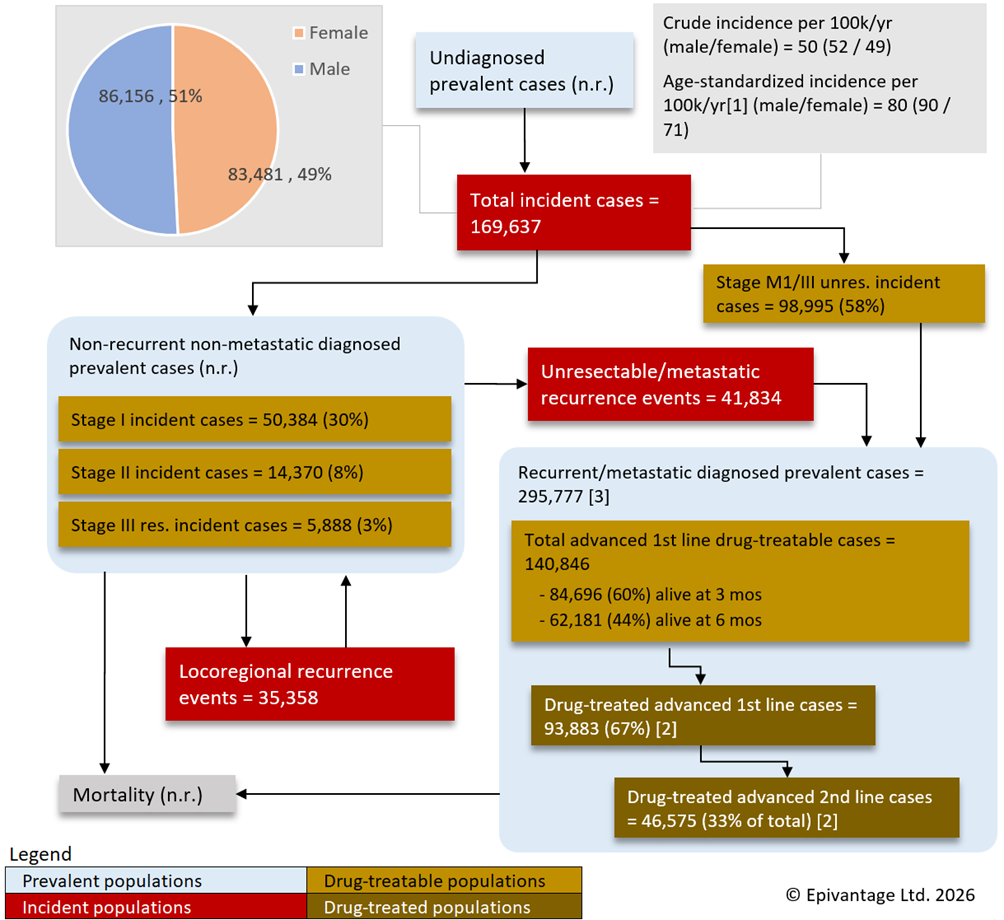
All our G26 Oncology Forecast Models have interactive patient flow diagrams which can be exported as image files and displayed for any combination of country and forecast year. In our partner program, epidemiologist hours can be used to derive patient flows for specific biomarker, mutation or alternative staging system populations.
Cancer Populations USA
Deep-dive long range customizable USA forecast models
Customizable race/ethnicity-based forecasts of cancer populations in the USA, stratified by race/ethnicity, state, tumor mutation status, biomarkers and line of treatment. Available as interactive downloadable Excel dashboards with accompanying PDF study report. Our Cancer Populations USA report series are on-demand (two-week delivery timeline), and customizable to any tumor definition, whether defined solely in terms of site and histology, or with additional gene mutations, biomarker status, stage criteria or treatment modality.
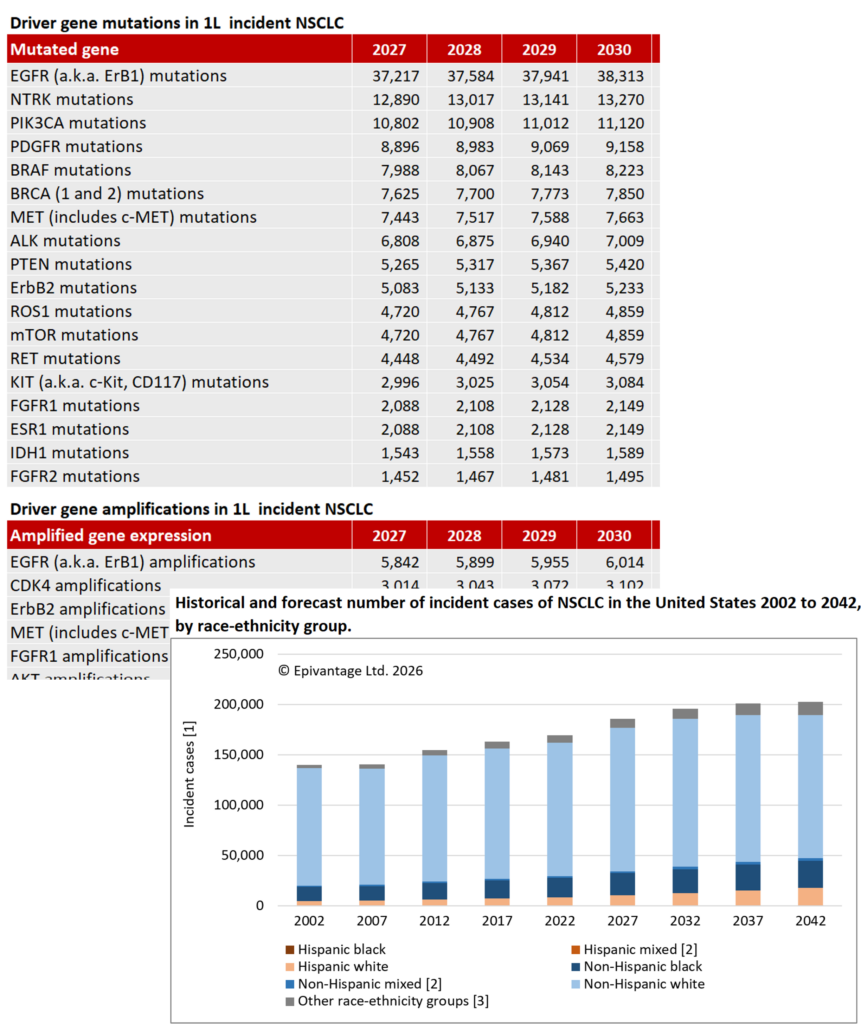
All our Cancer Populations USA reports are built from base year estimates of differential risk between different race-ethnicity groups and stratify first-line drug-treatable populations by a full panel of driver or potentially/actually druggable gene mutations.
Rare Disease Epidemiology Service
Custom-built epidemiology models of rare disease and niche indications
With our expertise in the modelling of rare disease epidemiology data, our familiarity with relevant datasets and the design of RWE studies in rare diseases, we can deliver rigorously researched, transparent interactive epidemiology forecast models. See our case studies from some recent examples.
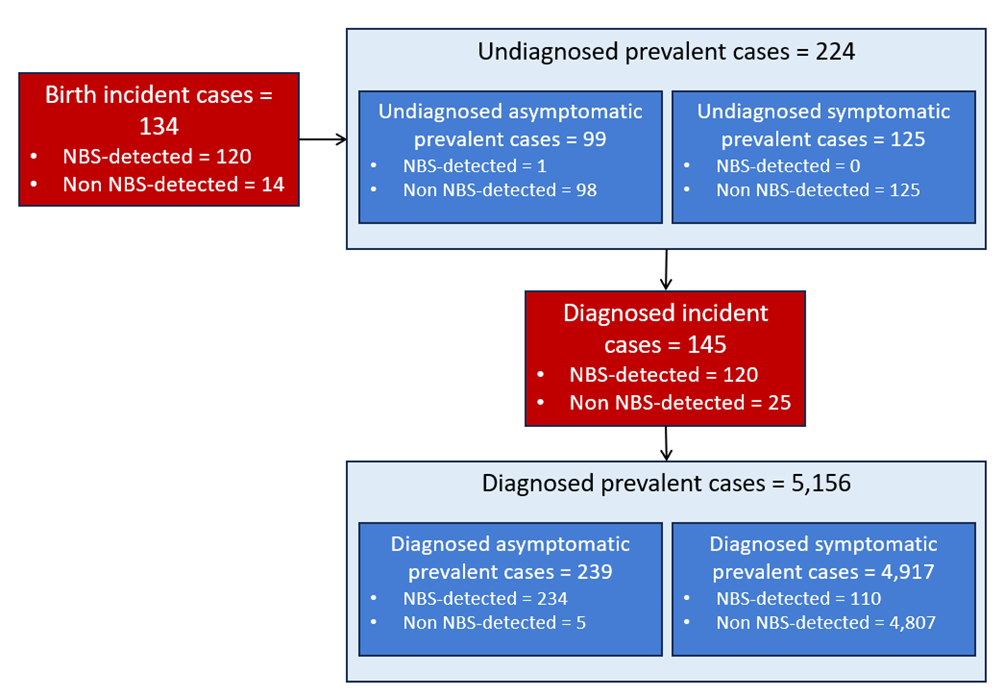
Using published newborn screening data for rare congenital disease, using our time-to-event and survival modeling approach, we can estimate multiple incident and prevalent populations following any initial newborn diagnosis, and add in the pre-existing populations not identified with newborn screening.
Ready to sign up for Library membership?
For existing subscribers, we set up membership within two working days. To find out if your organization is an existing subscriber, complete the Request Access form.