
NSCLC Cancer Populations USA 2026–2046
Overview
What is the global epidemiology of HER2 positive breast cancer (HR positive or negative) by world region In 2027?
- In 2027, across the high-income regions of North America, Western Europe and Asia Pacific (including China), 66,676 people will be diagnosed with HER2 positive breast cancer (HR positive or negative).
- China accounts for 38,788 cases, representing 58% of the total among those high-income regions.
- The risk of HER2 positive breast cancer (HR positive or negative) is highest in the Asia-Pacific (excluding China) region at 2.8 per 100,000 people per year, and lowest in the North America region at 2.7 per 100,000 people per year.
- Among specific high-income countries, the risk of HER2 positive breast cancer (HR positive or negative) is highest in South Korea at 2.8 per 100,000 people per year, and lowest in Australia at 2.7 per 100,000 people per year.
How many people will be diagnosed with HER2 positive breast cancer (HR positive or negative) in United States In 2027, and over the next 20 years?
- In 2027, 9,206 people will be diagnosed with HER2 positive breast cancer (HR positive or negative) in United States, representing a risk of 2.7 per 100,000 people per year. In 2047 this figure is forecast to be 23,437, representing a CAGR of 4.8% per year.
- Of the 9,206 people diagnosed with HER2 positive breast cancer (HR positive or negative) in United States in 2027, 9,208 will be treated with curative intent. In 2047 this figure is forecast to be 23,412.
- In 2027, 9,207 people will become eligible for first line drug-treatment of advanced (newly diagnosed or recurrent metastatic or otherwise unresectable) HER2 positive breast cancer (HR positive or negative) in United States In 2047 this figure is forecast to be 23,424.
How many people will be diagnosed with HER2 positive breast cancer (HR positive or negative) across Western Europe In 2027, and over the next 20 years?
- In 2027, 11,694 people will be diagnosed with HER2 positive breast cancer (HR positive or negative) across Western Europe, representing a risk of 2.7 per 100,000 people per year. In 2047 this figure is forecast to be 29,087, representing a CAGR of 4.7% per year.
- Of the 11,694 people diagnosed with HER2 positive breast cancer (HR positive or negative) in United States in 2027, 11,695 will be treated with curative intent. In 2047 this figure is forecast to be 29,050.
- In 2027, 11,695 people will become eligible for first line drug-treatment of advanced (newly diagnosed or recurrent metastatic or otherwise unresectable) HER2 positive breast cancer (HR positive or negative) in United States In 2047 this figure is forecast to be 29,069.
How many people will be diagnosed with HER2 positive breast cancer (HR positive or negative) across the G7 countries (the U.S., EU5, the U.K. and Japan) In 2027, and over the next 20 years?
- In 2027, 21,488 people will be diagnosed with HER2 positive breast cancer (HR positive or negative) across the G7 countries. In 2047 this figure is forecast to be 52,879, representing a CAGR of 4.6% per year.
- Of the 21,488 people diagnosed with HER2 positive breast cancer (HR positive or negative) in United States in 2027, 21,492 will be treated with curative intent. In 2047 this figure is forecast to be 52,818.
- In 2027, 21,490 people will become eligible for first line drug-treatment of advanced (newly diagnosed or recurrent metastatic or otherwise unresectable) HER2 positive breast cancer (HR positive or negative) in United States In 2047 this figure is forecast to be 52,849.
How many people will be diagnosed with HER2 positive breast cancer (HR positive or negative) in the China In 2027, and over the next 20 years?
- In 2027, 3,368 people will be diagnosed with HER2 positive breast cancer (HR positive or negative) in China, representing a risk of 2.8 per 100,000 people per year. In 2047 this figure is forecast to be 7,438, representing a CAGR of 4.0% per year.
- Of the 3,368 people diagnosed with HER2 positive breast cancer (HR positive or negative) in United States in 2027, 3,368 will be treated with curative intent. In 2047 this figure is forecast to be 7,428.
- In 2027, 3,368 people will become eligible for first line drug-treatment of advanced (newly diagnosed or recurrent metastatic or otherwise unresectable) HER2 positive breast cancer (HR positive or negative) in United States In 2047 this figure is forecast to be 7,433.
How many 1st line drug-treatable incident cases of HER2 positive breast cancer (HR positive or negative) will there be in high-income countries in 2027 and over the coming 20 years?
- In 2027, across North America (the U.S. and Canada), there will be 10,317 1st line drug-treatable incident cases, 15,163 in 2037 and 26,665 in 2047.
- Across Western Europe, there will be 11,695 1st line drug-treatable incident cases, 16,549 in 2037 and 29,069 in 2047.
- In the high-income countries of the Asia-Pacific region (excluding China), there will be 5,879 1st line drug-treatable incident cases, 8,027 in 2037 and 13,795 in 2047.
- In China, in 2027 there will be 38,790 1st line drug-treatable incident cases, 54,373 in 2037 and 95,506 in 2047.
- Across the G7 countries (the U.S., EU5, the U.K. and Japan), in 2027 there will be 21,490 1st line drug-treatable incident cases, 30,488 in 2037 and 52,849 in 2047.
How many stage IB newly diagnosed incident cases of HER2 positive breast cancer (HR positive or negative) will there be in high-income countries in 2027 and over the coming 20 years?
- In 2027, across North America (the U.S. and Canada), there will be stage IB newly diagnosed incident cases, in 2037 and in 2047.
- Across Western Europe, there will be stage IB newly diagnosed incident cases, in 2037 and in 2047.
- Across Western Europe, there will be stage IB newly diagnosed incident cases, in 2037 and in 2047.
- In China, in 2027 there will be 3,879 stage IB newly diagnosed incident cases, in 2037 and in 2047.
- Across the G7 countries (the U.S., EU5, the U.K. and Japan), in 2027 there will be 1,257 stage IB newly diagnosed incident cases, in 2037 and in 2047.
How many stage IIB newly diagnosed incident cases of HER2 positive breast cancer (HR positive or negative) will there be in high-income countries in 2027 and over the coming 20 years?
- In 2027, across North America (the U.S. and Canada), there will be stage IIB newly diagnosed incident cases, in 2037 and in 2047.
- Across Western Europe, there will be stage IIB newly diagnosed incident cases, in 2037 and in 2047.
- In the high-income countries of the Asia-Pacific region (excluding China), there will be stage IIB newly diagnosed incident cases, in 2037 and in 2047.
- In China, in 2027 there will be 4,655 stage IIB newly diagnosed incident cases, in 2037 and in 2047.
- Across the G7 countries (the U.S., EU5, the U.K. and Japan), in 2027 there will be 1,509 stage IIB newly diagnosed incident cases, in 2037 and in 2047.
How many stage IIIA newly diagnosed incident cases of HER2 positive breast cancer (HR positive or negative) will there be in high-income countries in 2027 and over the coming 20 years?
- In 2027, across North America (the U.S. and Canada), there will be stage IIIA newly diagnosed incident cases, in 2037 and in 2047.
- Across Western Europe, there will be stage IIIA newly diagnosed incident cases, in 2037 and in 2047.
- In the high-income countries of the Asia-Pacific region (excluding China), there will be stage IIIA newly diagnosed incident cases, in 2037 and in 2047.
- In China, in 2027 there will be 4,655 stage IIIA newly diagnosed incident cases, in 2037 and in 2047.
- Across the G7 countries (the U.S., EU5, the U.K. and Japan), in 2027 there will be 1,509 stage IIIA newly diagnosed incident cases, in 2037 and in 2047.
How many stage IIIA unresected newly diagnosed incident cases of HER2 positive breast cancer (HR positive or negative) will there be in high-income countries in 2027 and over the coming 20 years?
- In 2027, across North America (the U.S. and Canada), there will be stage IIIA unresected newly diagnosed incident cases, in 2037 and in 2047.
- Across Western Europe, there will be stage IIIA unresected newly diagnosed incident cases, in 2037 and in 2047.
- In the high-income countries of the Asia-Pacific region (excluding China), there will be stage IIIA unresected newly diagnosed incident cases, in 2037 and in 2047.
- In China, in 2027 there will be 4,267 stage IIIA unresected newly diagnosed incident cases, in 2037 and in 2047.
- Across the G7 countries (the U.S., EU5, the U.K. and Japan), in 2027 there will be 1,383 stage IIIA unresected newly diagnosed incident cases, in 2037 and in 2047.
How many stage IIIB newly diagnosed incident cases of HER2 positive breast cancer (HR positive or negative) will there be in high-income countries in 2027 and over the coming 20 years?
- Across Western Europe, there will be stage IIIB newly diagnosed incident cases, in 2037 and in 2047.
- In the high-income countries of the Asia-Pacific region (excluding China), there will be stage IIIB newly diagnosed incident cases, in 2037 and in 2047.
- In China, in 2027 there will be 3,879 stage IIIB newly diagnosed incident cases, in 2037 and in 2047.
- Across Western Europe, there will be stage IIIB newly diagnosed incident cases, in 2037 and in 2047.
- Across the G7 countries (the U.S., EU5, the U.K. and Japan), in 2027 there will be 1,257 stage IIIB newly diagnosed incident cases, in 2037 and in 2047.
Key statistics
Executive summary
Newly diagnosed incident cases
Stage Ia newly diagnosed incident cases
Stage Ib newly diagnosed incident cases
Stage IIA newly diagnosed incident cases
Stage IIIA newly diagnosed incident cases
Stage IIIB newly diagnosed incident cases
Stage IIIC newly diagnosed incident cases
First line drug-treated Incident cases
1st line drug-treatable incident cases
Second Line drug-treated Incident cases
Unresectable recurrent incident cases
Second Line drug-treated Incident Cases
Stage IB newly diagnosed incident cases
Stage IIA newly diagnosed incident cases
Stage IIB newly diagnosed incident cases
Stage IIIA newly diagnosed incident cases
Stage IIIA unresected newly diagnosed incident cases
Stage IIIB newly diagnosed incident cases
Stage IIIB unresected newly diagnosed incident cases
Stage IIIC newly diagnosed incident cases
Stage IIIC unresected newly diagnosed incident cases
Stage IV newly diagnosed incident cases
Unresected newly diagnosed incident cases
1st line drug-treatable incident cases PS<2
2nd line drug-treatable incident cases PS<2
First line drug-treatable incident cases with PS > 1
First line drug-treatable incident cases with PS < 2
Second line drug-treatable incident cases with PS > 1
Second line drug-treatable incident cases with PS < 2
PD-L1 positive first line drug-treatable incident cases
Subpop 24
Subpop 25
Subpop 26
Subpop 27
EGFR (a.k.a. ErB1)
NTRK
PIK3CA
BRAF
PDGFR
BRCA (1 and 2)
MET (includes c-MET)
ErbB2
ALK
mTOR
RET
Preview charts
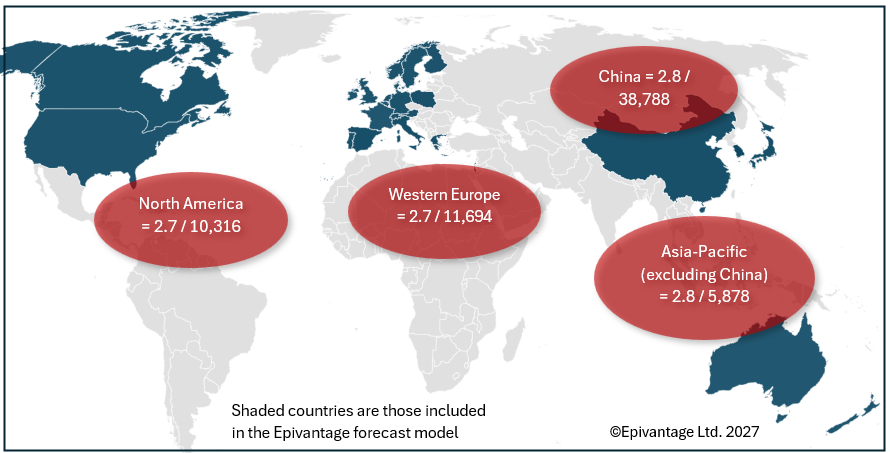
Newly diagnosed incidence per 100k/yr / cases by world region, 2027
Au = Australia; At = Austria; Be = Belgium; Ca = Canada; Cn = China; Dk = Denmark; Fi = Finland; Fr = France; De = Germany; Gr = Greece; Ie = Ireland; Il = Israel; It = Italy; Jp = Japan; Ne = Netherlands; NZ = New Zealand; No = Norway; Pl = Poland; Pt = Portugal; Sg = Singapore; Kr = South Korea; Es = Spain; Se = Sweden; Ch = Switzerland; UK = United Kingdom; US = United States
Forecast populations
Methodology summary
This model employs a validated epidemiological forecasting framework drawing on data from SEER, NCI, and proprietary sources. Incidence projections are derived using age-period-cohort (APC) modeling, while prevalence estimates incorporate survival rate adjustments from published clinical literature and real-world evidence datasets.
Forecast uncertainty is expressed through probabilistic ranges at 80% and 95% confidence intervals. Scenario analyses are provided for optimistic, base case, and conservative assumptions across key modeling parameters.
Downloads (members only)
Request access to download the study report and Excel dashboard.
Get access in 3 steps*
Request access →*Subject to pre-existing enterprise-wide access
Submit access request
Complete our access request form with your details.
Review credentials
Review of any enterprise-wide subscription rights.
Start downloading!
Download any of our forecast models and reports.
Can't find what you need?
Our research team can develop custom forecast models tailored to your specific requirements.
Enquire about commissioning custom research →